This is the core of The Vessel. Our method, our indicators, our recommended resources, and where we trade. Everything here is what we actually use — not theory.
The Method
How Constantinos Trades
This is not a scalping strategy. It is not a day trading system. It is a method built around patience, the higher timeframe, and sitting inside a trade for weeks or months until the full move plays out.
01
Start With the Monthly Candle
Before looking at any other timeframe, the monthly chart is consulted first. The monthly candle tells you the macro direction of the asset. If the monthly is bullish, you are only looking for long setups on the lower timeframes. If it is bearish or indecisive, you wait. Most traders never zoom out this far — which is exactly why they get caught in the noise.
02
Zoom Out. Always.
The greatest mistake in trading is making decisions on the 5-minute chart while the 4-hour chart is telling you the opposite story. Every trade decision is made by reading the monthly → weekly → daily → 4H in sequence. The lower timeframe is only used for entry precision. The higher timeframe is the verdict.
03
Sit in the Trade
Day trading lovers will disagree — and that is fine. The most profitable trades in this method are the ones held for weeks or months. A position opened on a monthly breakout is not managed on a 15-minute chart. It is left to run. The target is the next major structure level on the weekly or monthly chart. Patience is the edge.
04
Structure Over Indicators
Price structure — support, resistance, previous highs and lows, consolidation zones — is the primary tool. Indicators are used to confirm, not to lead. A clean support level on the monthly chart carries more weight than any oscillator reading. The market respects structure because everyone can see it.
"Day traders will say they don't prefer this approach. But trading the monthly candles and sitting in a position for months is what I find most profitable. Always look at the greater picture. Zoom out. The noise disappears."
— Constantinos Darzentas, Founder of Trade Vessel
The Timeframe Hierarchy
Timeframe
Purpose
What to Look For
Weight
Monthly
Macro direction & major structure
Trend direction, major support/resistance, breakouts
These are the indicators used in every analysis. Not a collection of 12 overlapping oscillators — a small, deliberate set that each answers a specific question.
S/R
Support & Resistance Levels
The foundation of every trade. Previous highs and lows, consolidation zones, and round numbers on the weekly and monthly chart. These are the levels the market returns to. Everything else is built around them.
EMA
Exponential Moving Averages
The 21 EMA and 200 EMA on the weekly chart. The 21 EMA acts as a dynamic support/resistance in trending markets. The 200 EMA defines the long-term trend. Price above the 200 EMA on the weekly = bullish bias. Below = caution.
VOL
Volume Profile
Volume confirms or denies a breakout. A breakout on low volume is a trap. A breakout on high volume is a signal. Volume profile also reveals high-value areas where price tends to return — these are the zones where the best entries exist.
FR
Funding Rates
In crypto perpetual futures, extreme positive funding rates signal a dangerously overcrowded long market. Extreme negative rates signal capitulation. Used as a contrarian sentiment indicator — not as a timing tool, but as a risk filter.
RSI
RSI (Weekly / Monthly Only)
The RSI is only meaningful on the weekly and monthly chart. A monthly RSI above 80 is a warning. A monthly RSI below 30 is an opportunity. On lower timeframes, RSI generates too much noise to be useful.
DOM
BTC Dominance
When BTC dominance rises, altcoins bleed. When it falls, altcoins outperform. Dominance is tracked on the weekly chart to understand where capital is flowing in the broader market — critical for timing altcoin positions.
Who to Learn From
Francis Hunt — The Market Sniper
Of all the traders and educators we have studied, Francis Hunt is the one we recommend without reservation. His approach to markets aligns closely with our own: higher timeframes, structure, patience, and a method that works across all asset classes.
Recommended Educator
Francis Hunt
The Market Sniper · HVF Method
30+ years of trading experience. Originator of the Hunt Volatility Funnel (HVF) trading methodology. Named in the top 100 crypto and blockchain influencers.
Unlike most educators, Francis trades his own capital. He is not selling signals or subscriptions — he is teaching a method he built for himself over three decades.
The HVF Method is a technical trading methodology built around one core question: what is the next best performing trade? It identifies periods of low volatility — the "funnel" — that precede major breakout moves, and positions the trader to capture the expansion that follows.
The HVF Method is based purely on technical analysis. Price action is the truest reflection of all factors that influence an asset. Fundamentals often follow price — not the other way around.
Why We Recommend Him
The alignment between Francis Hunt's philosophy and our own is significant. Both approaches prioritise the higher timeframe over the noise of intraday charts. Both treat patience as a skill, not a personality trait. Both reject the idea that more indicators equals better analysis.
Francis has been trading since 1987. He has seen multiple full market cycles — bull markets, crashes, recoveries. His perspective on crypto is informed by decades of watching the same psychological patterns repeat across every asset class.
The 7 Principles of the HVF Method
01
Identify the Volatility Funnel
Find periods of contracting price range — the market is coiling before a major move. This is the setup phase.
02
Define the Breakout Level
The upper and lower boundaries of the funnel define the breakout levels. A close outside these levels is the trigger.
03
Pre-determine All Levels
Entry, stop-loss, and take-profit are all calculated before the trade is opened. No decisions are made in the heat of the moment.
04
Optimal Reward-to-Risk
The HVF only takes trades where the reward-to-risk ratio justifies the position. Minimum 3:1 is the standard.
05
Works on All Markets
The method applies to crypto, forex, equities, and commodities. The pattern is universal because human psychology is universal.
06
Medium to Long Term
The HVF works best on the daily, weekly, and monthly charts. Short-term charts generate false signals. Patience is the edge.
07
Mindset as a System
The method includes a psychological framework — eliminating FOMO, fear of loss, and the compulsion to trade. The system removes the ego from the decision.
Recommended Video
This is the video we recommend watching first. Francis Hunt lays out the core argument that every individual is solely responsible for their own financial future — and that the system, including central banks and inflation, is working against you. He calls it the financial casino. His message: stop being the punter on the losing side of the table. Take 100% responsibility, learn the mechanics, and build a method that removes emotion from every decision. This is the mindset behind everything we teach at The Vessel.
Where to Trade
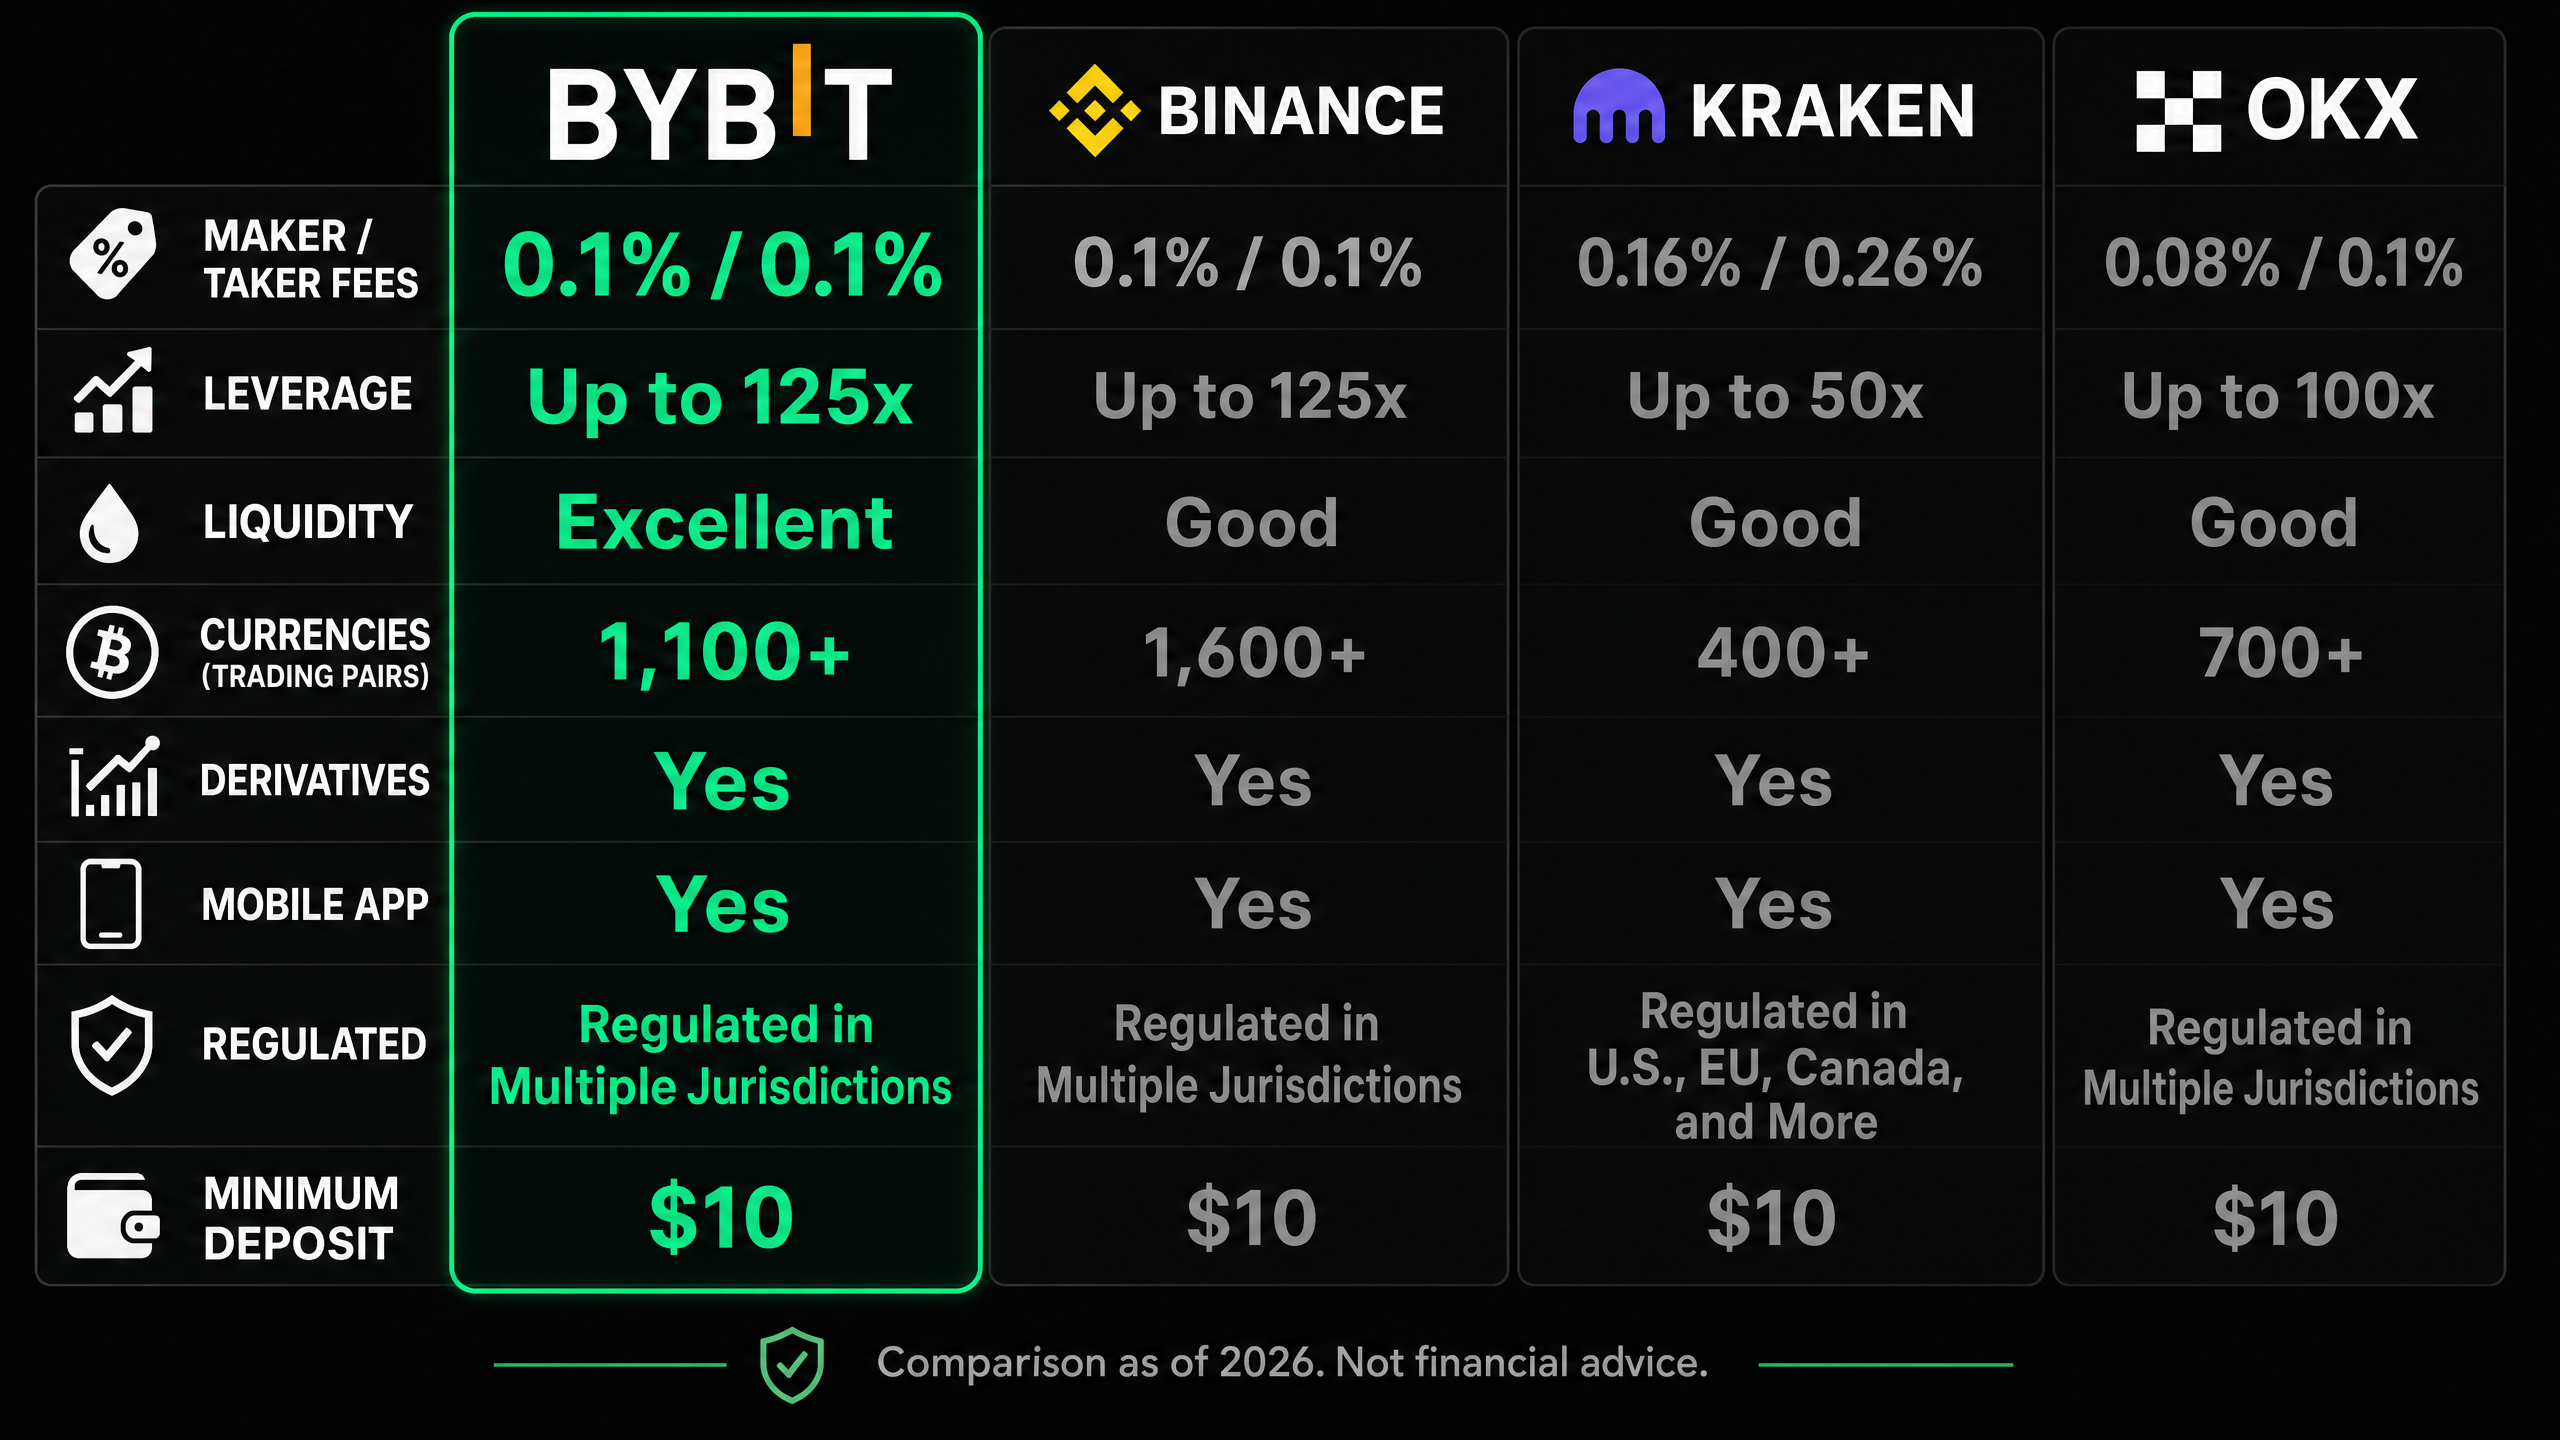
Why We Use Bybit
We have traded on multiple exchanges. After years of comparing fees, liquidity, tools, and reliability, Bybit is where we operate. Here is why — and how it compares to the alternatives.
Tap image to view full size · Fees shown are maker/taker for standard accounts.
Market analysis, trade breakdowns, and educational content — all built around the same method documented here.
@TradeVessel
We publish market analysis, trade reviews, and educational content on our YouTube channel. Everything is built around the same principles taught in The Vessel — higher timeframe analysis, patience, and structure over noise.
Written analysis of market mechanics, institutional behavior, and trading psychology. No signals. No price targets. Just the mechanics behind the moves.
Market Mechanics
The Stop-Hunt Anatomy: How Institutions Collect Retail Liquidity
Every time you place a stop-loss at the obvious level, you are contributing to a liquidity pool that institutions actively target. This is not a conspiracy — it is the mechanical reality of how large orders get filled.
June 20268 min read
Derivatives
Funding Rates as a Contrarian Signal: The Data from 2021–2026
Every major crypto crash since 2021 was preceded by extreme positive funding rates. Here is the data and the framework for using it.
May 20266 min read
Psychology
Why Smart People Lose Money in Crypto: The Ego Trap
Intelligence is not an advantage in trading. In many cases, it is a liability. Here is why, and what to do about it.
April 20267 min read
Risk Management
The 1% Rule: Why Professional Traders Never Risk More
The mathematics of survival in trading are simple. The psychology of following them is not.
March 20265 min read
Market Snapshot
BTC/USDTLoading…
ETH/USDTLoading…
BTC Funding+0.01%
ETH Funding+0.008%
BTC Dominance58.4%
Fear & Greed—
Start Learning
New to The Vessel? Start with the free course and the psychology book.
The Stop-Hunt Anatomy: How Institutions Collect Retail Liquidity
June 20268 min read
Every time you place a stop-loss at the obvious level — just below support, just above resistance — you are adding to a pool of pending orders that institutional traders can see and deliberately target. This is not a conspiracy theory. It is a mechanical consequence of how markets work.
What is a Stop-Hunt?
A stop-hunt is the deliberate movement of price into a zone dense with stop-loss orders, triggering them en masse, and then reversing. The institution that executes the hunt fills its real position at the best possible price — using your stop-loss as the exit liquidity it needed.
The core mechanic: your stop-loss is a pending market order. A cluster of stop-losses is a pool of liquidity. Large players need liquidity to fill large positions. They hunt it deliberately.
Why Retail Traders Are Predictable
Retail traders are taught to place stops at the same locations: below the last swing low, below a round number, below a trendline. These are the levels that appear in every trading textbook. Because everyone reads the same books, everyone places stops at the same levels. This creates dense, predictable liquidity pools that are visible to anyone with access to aggregated order flow data.
How to Protect Yourself
The solution is not to stop using stop-losses — it is to stop placing them at the obvious level. Place your stop beyond the zone where the hunt would have to reach to trigger it. This means accepting a slightly larger stop distance, which means reducing your position size to maintain the same dollar risk. This is not a disadvantage. It is the correct approach.
The second protection is to wait for the hunt to complete before entering. The spike candle that breaks the level and immediately reverses is the hunt completing. That reversal candle is often the best entry in the entire setup.
Funding Rates as a Contrarian Signal: The Data from 2021–2026
May 20266 min read
The funding rate is one of the most reliable contrarian signals in crypto markets. Every major crash since 2021 was preceded by extreme positive funding rates. Every major bottom was preceded by extreme negative funding rates. The data is consistent. The signal is ignored by most retail traders.
How Funding Rates Work
In perpetual futures markets, the funding rate is the mechanism that keeps the futures price anchored to the spot price. When the futures price is above spot, longs pay shorts. When it is below, shorts pay longs. The rate is calculated every 8 hours and reflects the imbalance between long and short positions.
When funding rates reach extreme highs, the market is dangerously overcrowded with longs. The correction that follows is not a prediction — it is a mechanical inevitability. The longs must be flushed before the market can move higher.
The Historical Pattern
In November 2021, BTC funding rates on major exchanges reached +0.1% to +0.15% per 8-hour period — among the highest ever recorded. BTC peaked at $69,000 and fell 75% over the following year. In June 2022, funding rates went deeply negative as the market capitulated. That was the bottom. The pattern repeated in 2024 and again in early 2026.
How to Use It
Extreme positive funding is not a signal to short immediately — it is a signal to reduce long exposure and wait. Extreme negative funding is not a signal to buy immediately — it is a signal to begin accumulating carefully. The funding rate tells you the conditions, not the timing.
Why Smart People Lose Money in Crypto: The Ego Trap
April 20267 min read
The most dangerous trader in the market is not the inexperienced one. It is the intelligent, successful person who enters trading believing that their analytical skills will translate directly into trading success. They often do — for a while. And that is the problem.
Why Intelligence Can Be a Liability
Intelligent people are good at constructing narratives. They can build a compelling case for why a trade should work. They can find data that supports their thesis. They can argue convincingly — to themselves — that a losing position will recover. This is not analysis. It is rationalization. And it is the mechanism by which intelligent people hold losing trades far longer than they should.
The ego does not distinguish between being right about the market and being right in an argument. It simply needs to be right. When the market disagrees, the ego constructs a narrative to explain why the market is wrong and you are right. This is the ego trap.
The Solution
The solution is not to become less intelligent. It is to build systems that remove the ego from the decision-making process. A pre-defined stop-loss that is executed automatically. A position size that is calculated before the trade is opened. A rule that prohibits adding to losing positions. These systems work not because they are clever, but because they are mechanical. They do not care about your narrative.
The 1% Rule: Why Professional Traders Never Risk More
March 20265 min read
The 1% rule is the single most important concept in trading risk management. It states that no single trade should risk more than 1% of your total trading capital. It sounds conservative. It is, in fact, the only approach that allows for long-term survival in a market where losing streaks are inevitable.
The Mathematics
If you risk 1% per trade and experience 10 consecutive losses — an extreme but possible scenario — you retain 90.4% of your capital. If you risk 5% per trade and experience the same 10 losses, you retain 59.9% of your capital. If you risk 10% per trade, you retain 34.9%. The difference compounds dramatically over time.
Position Size = (Account Balance × Risk Percentage) / Stop-Loss Percentage. A €10,000 account risking 1% with a 2% stop-loss should use a position size of €5,000. The stop-loss will cost €100 — exactly 1% of the account.
Why Traders Ignore It
The 1% rule feels slow. It feels like it will take forever to grow an account. This feeling is the problem. The goal of risk management is not to maximize returns — it is to maximize the number of trades you can take before a losing streak destroys your capital. With 1% risk, you can survive 50 consecutive losses and still have 60% of your account. That is survivability. That is the foundation of compounding.